Bank Check · Day 5 of 6. An investor's guide to ROA and ROE: what they measure, why they can point in opposite directions, and how to read them together.
In the quarter to 30 September 2026, one bank in our comparison earned 1.92% on its assets and 11.7% on its equity. Another earned just 1.05% on its assets, yet 17.3% on its equity. Neither number alone tells you which bank is more profitable. Here's how to read the two together.
What ROA and ROE measure
Both start from the same profit. They differ in what they divide it by. Picture a bank holding ₹100 of loans and bonds: only a small slice is shareholders' money, and the rest is deposits and borrowings. ROA measures profit on all ₹100. ROE measures profit on the owners' slice.
Read four numbers together:
- ROA = Net profit ÷ Average total assets. How hard the whole balance sheet works. An ROA of 1.5% means about ₹1.50 of profit a year for every ₹100 of assets.
- ROE = Net profit ÷ Average shareholders' equity. What the owners' money earns
- Leverage = Average assets ÷ Average equity. The bridge between the two: ROE ≈ ROA × leverage.
- Annualised. Quarterly ratios are usually a quarter's profit scaled up to a full year, so a one-off gain gets scaled up too.
That bridge is the key. A bank can raise its ROE either by earning more on its assets or by running more assets on the same capital. The first is efficiency. The second is borrowing.
ROA and ROE across bank categories, Q2 FY27
Across the 10 banks in our series, ROA ran from 0.87% to 2.40% and ROE from 7.4% to 19.7%. The two did not rank the banks the same way.

ROA and ROE as reported for Q2 FY27, annualised · 10 banks · sources at the end
Both public sector banks sit near the 16× leverage line: a thin ROA of about 1%, but ROEs of 17% to 18%. Most private and small finance banks sit between about 6× and 10×, so their stronger ROAs translate into similar or lower ROEs.
The securities quoted are for illustration only and are not recommendatory.
What actually drives the number
The gap between ROA and ROE has three usual causes: leverage, spare capital, or a business still recovering. One bank per category, Q2 FY27:
- Public sector: leverage. ROA of 1.05% and ROE of 17.3%. Its assets are about 16.5 times its equity, so a thin return on assets becomes a high return for shareholders.
- Large private: spare capital. ROA of 1.92% but ROE of 11.7%. Its assets are only about 6 times its equity. With that much capital, even a strong ROA translates into a modest ROE.
- Mid-size private: a recovery. ROA improved 9 basis points from the previous quarter to 0.87%, with ROE at 7.4%. In the same quarter a year earlier, the bank reported a net loss.
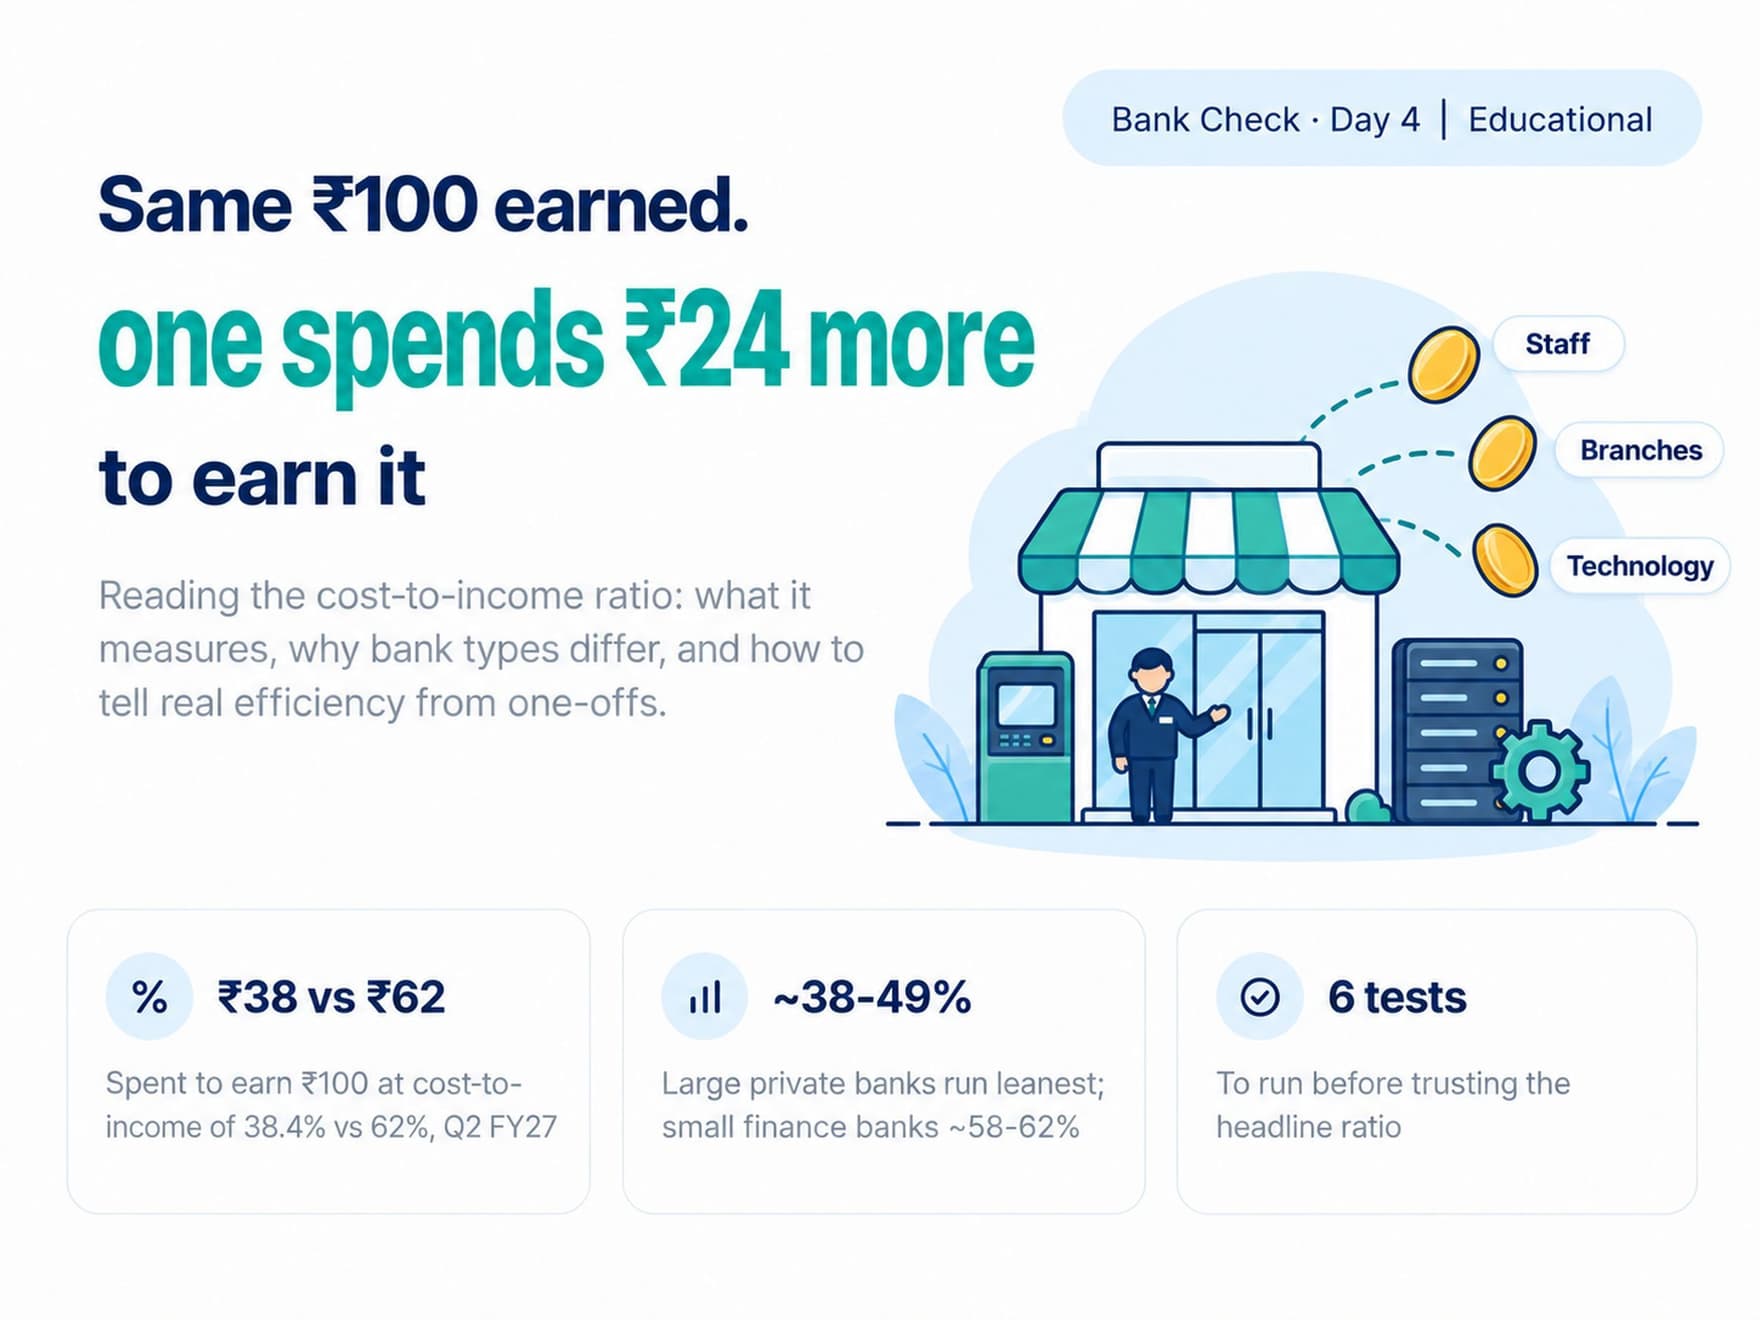
- Small finance: the business model. ROA of 2.40% and ROE of 19.7%, the highest in our comparison. An 8.4% NIM (Day 1) more than covers a 62% cost-to-income ratio (Day 4).
A high ROE built on high leverage leaves a thinner cushion if loans go bad. A low ROE can simply mean capital that hasn't been put to work yet.
Leverage is a Truenova calculation (ROE ÷ ROA) from reported figures, rounded. The securities quoted are for illustration only and are not recommendatory.
Six tests before you read a bank's ROA and ROE
- Both, together. Red flag: ROE rising while ROA falls, which means more borrowing, not more profit.
- The leverage behind ROE. Red flag: a high ROE that rests mostly on thin capital.
- One-offs. Red flag: an ROA jump that comes from a one-time treasury gain or tax write-back.
- Same period, same basis. Red flag: comparing one bank's annualized quarter with another's half-year figure.
- Against the cushion. Red flag: a high ROE alongside a capital ratio near the regulatory minimum.
- Like with like. Red flag: judging a public sector bank's ROA against a small finance bank's.
The takeaway: profit tells you what a bank made; ROA and ROE tell you what it took
The series so far fits into one chain: NIM → minus bad loans → minus running costs → profit → ROA and ROE. A higher ROE is not automatically a better bank. Check whether it comes from earning more on assets or from stretching the same capital further.
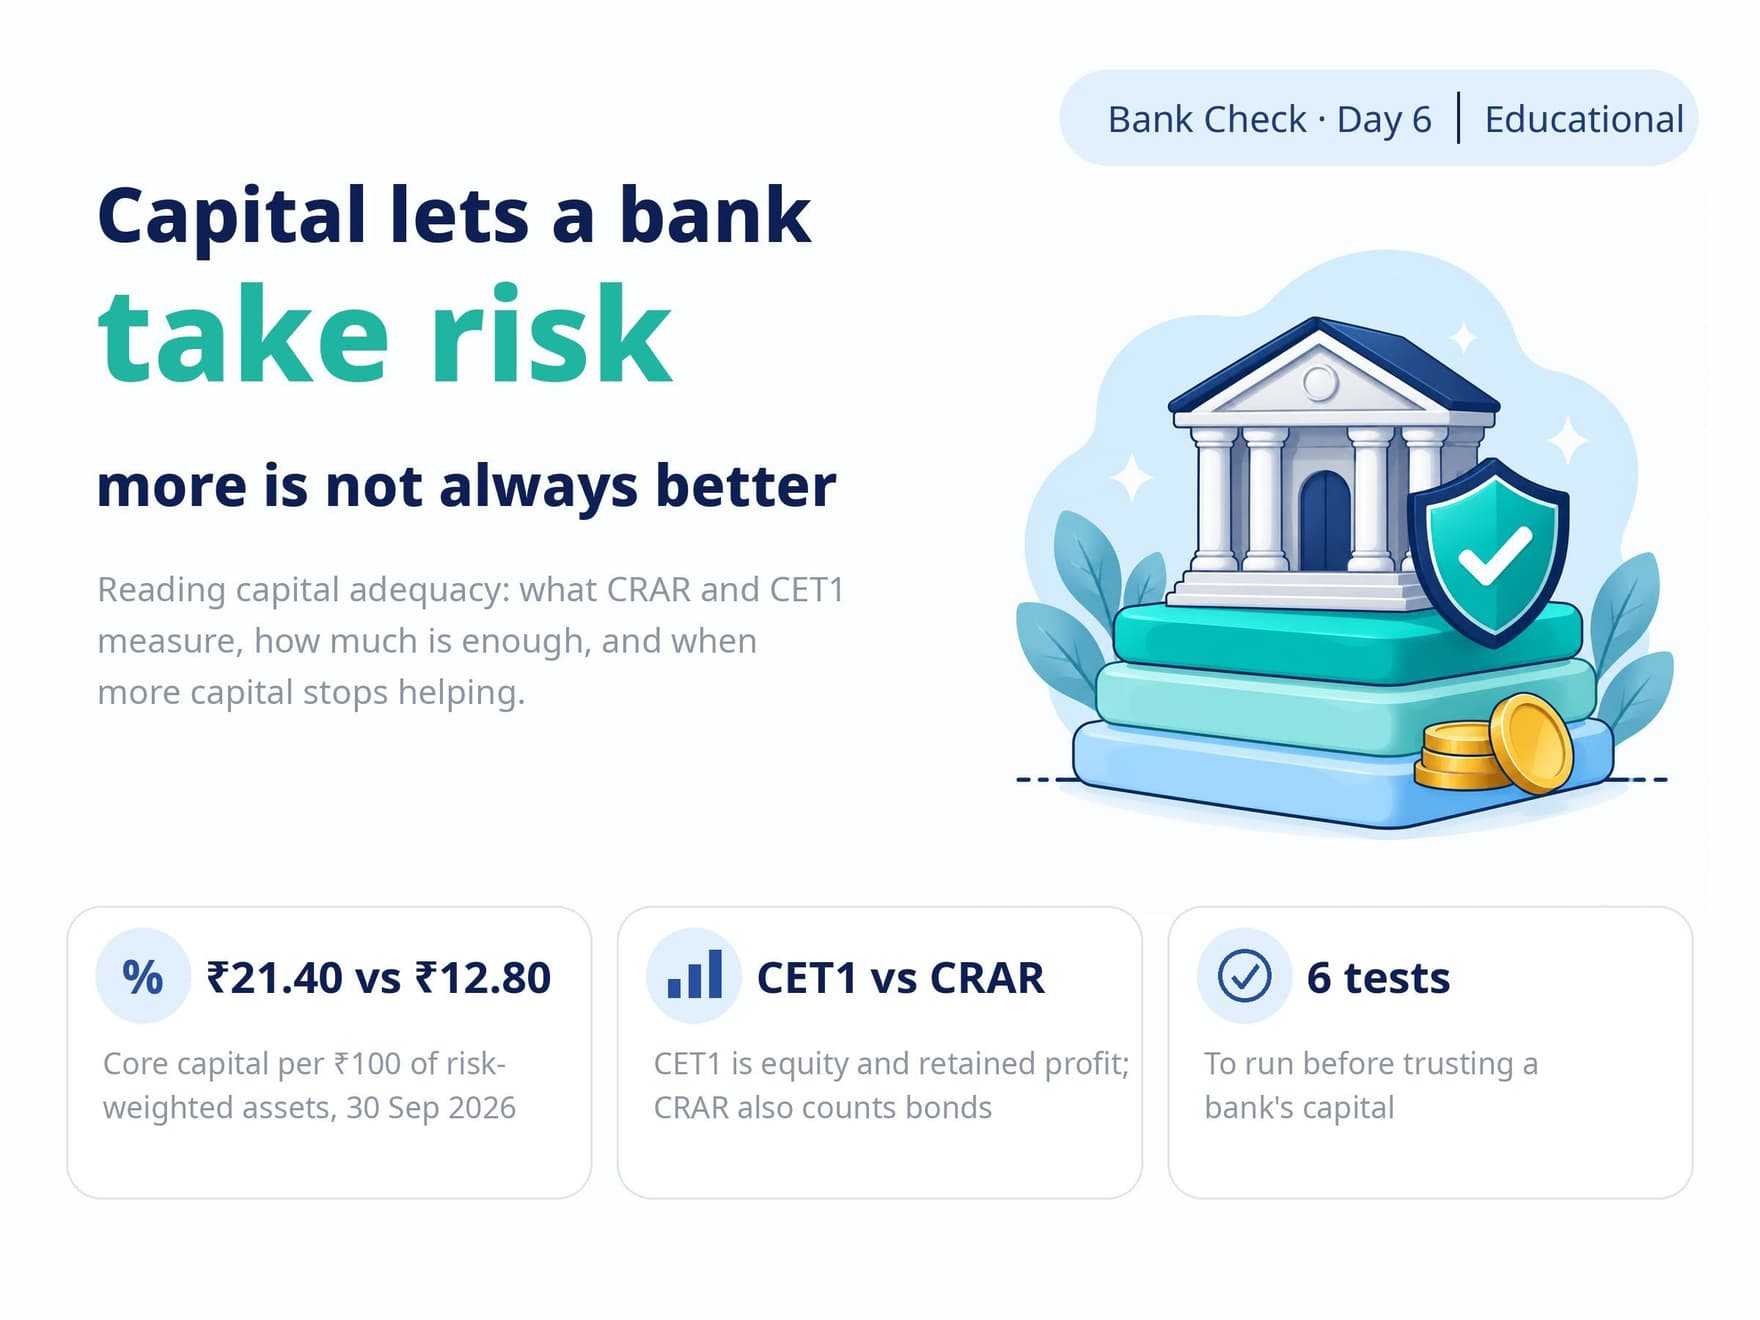
Next in Bank Check: Day 6 covers capital adequacy: how much cushion a bank holds against losses, and why it limits how far ROE can stretch.
Frequently asked questions
What is a good ROA for an Indian bank?
There is no single good number; it depends on the bank's category. In Q2 FY27, public sector banks in our comparison reported about 1.0%, large private banks about 1.4% to 2.3%, and small finance banks about 1.7% to 2.4%. Compare a bank with its own peers and its own history.
Why can a bank with a lower ROA have a higher ROE?
Because ROE ≈ ROA × leverage. A bank that runs more assets on each rupee of equity turns a thin ROA into a higher ROE, at the cost of a thinner capital cushion.
Should I look at ROA or ROE?
Both. ROA shows how efficiently the bank earns on everything it holds. ROE shows what that means for shareholders. Reading them together tells you how much of the ROE comes from leverage.